To take a diagrammatic look at New Zealand’s history of political parties is interesting not only from a historical perspective, but also in order to study the effect of electoral systems on party systems. In 1994, the country voted to change its electoral system from first-past-the-post to German-style mixed-member proportional (MMP), which is much less restrictive towards political parties. In addition, from 1908 to 1913, the country used a two-round system, which is less restrictive than first-past-the-post, but more so than MMP.
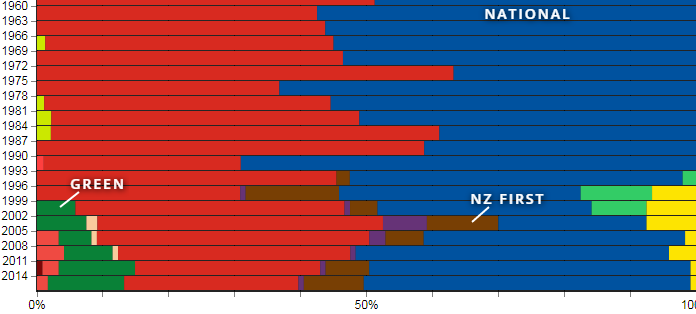
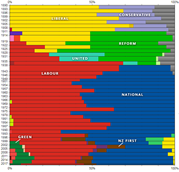
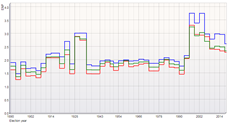
I created two interactive charts. The first is a history of the proportion of seats in parliament held by each party (part of a series including similar studies of the US and Australia). The second is a chart showing the effective number of parties (ENP) over time. Both charts span the period from 1890, the beginning of party politics in New Zealand, to the present. I compiled the data from Wikipedia (for example, the page for the 2014 elections); it is simplified slightly — changes between general elections are not shown.
Position your mouse over the data for more information about each party’s representation in a given parliament. Use the button on the right to show or hide party labels. Note that the position of one party to the left or right of others should not be considered too significant, as I’m not well acquainted with the platforms or leadership of these parties.
There seems to be a discernible change in the nature of the party system after the 1994 reform. The system appears to become more accommodating than before to minor parties.
The second chart, below, show the effective number of parties (ENP) based on party representation in parliament. This measure was first devised by Laakso and Taagepera (1979), who developed a formula for not only counting the number of parties in a legislative body, but weighting them by their relative strength, so that, for example, a chamber that was equally divided between two parties would have an ENP of 2.0, but if one of the parties had 60% and the other 40%, the ENP would be 1.92. To compute this, you take the fraction of seats held by each party and square it, then add them all together: for example, 0.602 + 0.402 = 0.36 + 0.16 = 0.52. Then, take the inverse: 1 / 0.52, or 1.92.
Years later, Dunleavy & Boucek (2003) and Golosov (2010) offered modifications of the formula, to better reflect what they thought was the most accurate picture of reality. I don’t know which formula is best; I show all three measures in the chart. All of them collapse a wealth of qualitative information about the relevance of particular parties into a simplified quantity, and thus should be taken with a grain of salt. Nevertheless, I think we can glean some relevant information from the big picture of how these measures have changed over time.
Position your mouse beneath the data lines to get the exact figures for a given parliament.
Here we seem to find confirmation of what was visible in the first chart: that the system changed meaningfully after the 1994 reform, shifting from two-party to multi-party. This is to be expected from a switch to MMP, which restricts political parties far less than a plurality voting system. The gradual decline in ENP after 1996 could be the result of a natural “settling” process: Given peace, prosperity, and stability in sociopolitical cleavages, all of which I believe have marked New Zealand’s experience of the last few decades, the demand for party innovation probably tends naturally to subside. But if future circumstances generate intensifying party competition, the system presumably would not impede a rise in the effective number of political parties.
Like all functioning democracies, New Zealand has had a rich history of political parties. In the thick of contemporary partisan divisions, it can be easy to forget about the variety of parties in government in the past — not to mention those which competed in the electoral arena but failed to win seats. Beyond this variety of parties, there are important differences in party systems, which depend on the nature of the competitive landscape defined by law, especially electoral law. In charting the makeup of the country’s party system over time, I hope this article helps to illuminate the connection between electoral system and party system, two critical sub-systems of modern democracy.
Source data:
Notes:
[1] Laakso, M. and R. Taagepera (1979), “‘Effective’ Number of Parties: A Measure with Application to West Europe”, Comparative Political Studies 12: 3–27.
[2] Dunleavy, Patrick and Françoise Boucek (2003), “Constructing the Number of Parties”, Party Politics, vol. 9, no. 3 (2003), pp. 291-315.
[3] Golosov, Grigorii V. (2010), “The Effective Number of Parties: A New Approach”, Party Politics, vol. 16, no. 2 (2010), pp. 171-192.


